Parking reports: six questions, six answers
Most software answers the word "reports" with a long table: rows, columns, totals. But an operator does not carry a table in their head, they carry questions — what did we earn today, will tomorrow be busy, are mornings or evenings heavier, how many times has that plate been here. This page sets out which questions parking reports should answer, and which data each answer comes from.
Why a report should be a question, not a table
A table shows everything and says nothing. The reader has to know where to look before the number means anything; if they don't, the report gets opened once, stared at, closed, and never opened again. The question form reverses that order: the screen gives the answer, and whoever wants the detail taps it.
The practical difference: "September income and expense breakdown" is a heading; "What did we earn today?" is an answer, with a single number underneath it.
What did we earn today?
The day's income is parking collections plus subscription collections. Three details keep that number honest:
- Credit is not income. If no money changed hands, the till does not grow; the record sits separately as an open receivable and becomes income on the day it is collected.
- Discounts are already deducted. The figure shown is net; the discount given is a separate information line.
- Payment methods stay apart. Cash, card, online and bank transfer are counted in separate buckets — the "if it isn't card it's cash" assumption files online collections in the wrong place.
A day's income is dated by the exit time, because that is when the money is taken; a vehicle that stays past midnight belongs to the next day's takings.
What should we expect tomorrow?
This is not a forecasting model, it is an average: whatever weekday tomorrow is, you see the average of the same weekdays in the past. Weather, holidays and campaigns are not part of it, and the screen does not pretend otherwise.
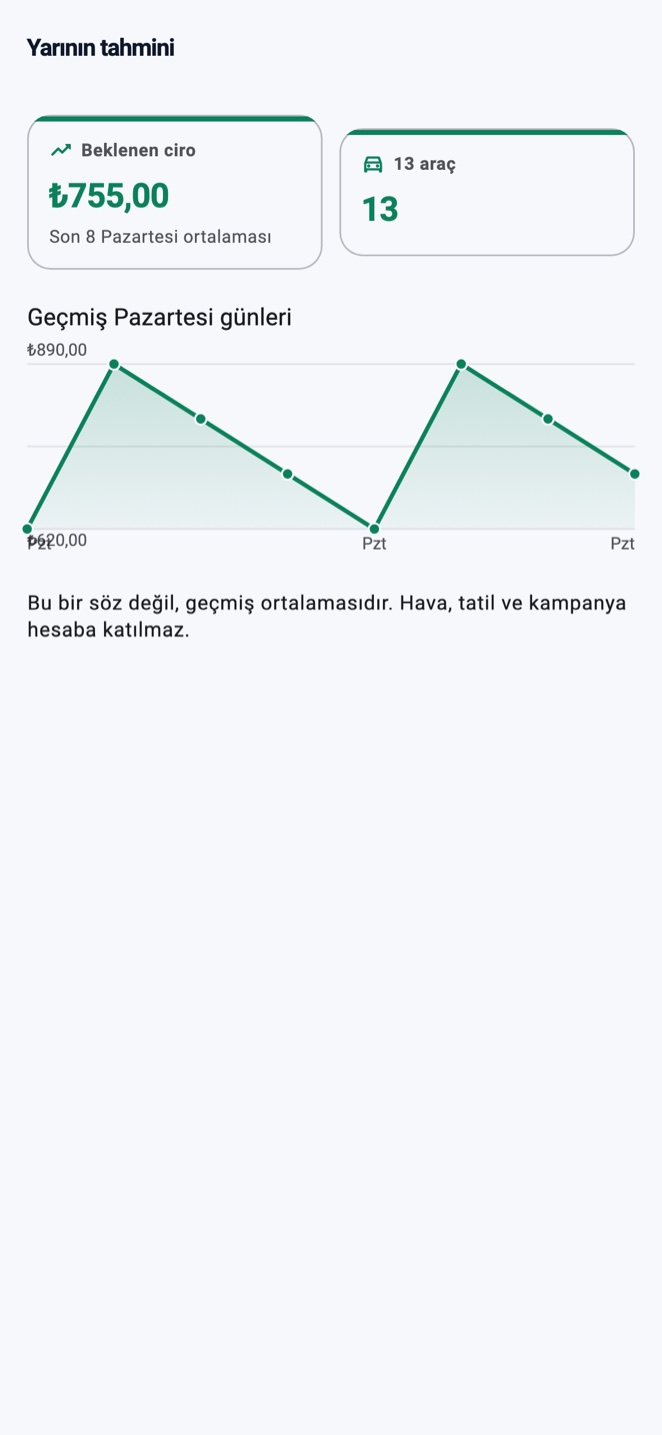 The forecast screen: expected takings, the number of observations and past same weekdays.
Two rules keep the number honest. First, the screen states how many days the average rests on — an average from three observations should not look like one from eight. Second, below two observations no number is shown at all: presenting a single day as an "average" is not averaging, it is repeating that day.
When are we busiest?
Busyness is broken down by weekday and by hour. The detail that matters is that counting uses the entry time: a crowd forms when vehicles arrive. Counting by exit time pushes the peak forward by roughly the average length of stay — a car park that fills in the morning would look busy in the afternoon.
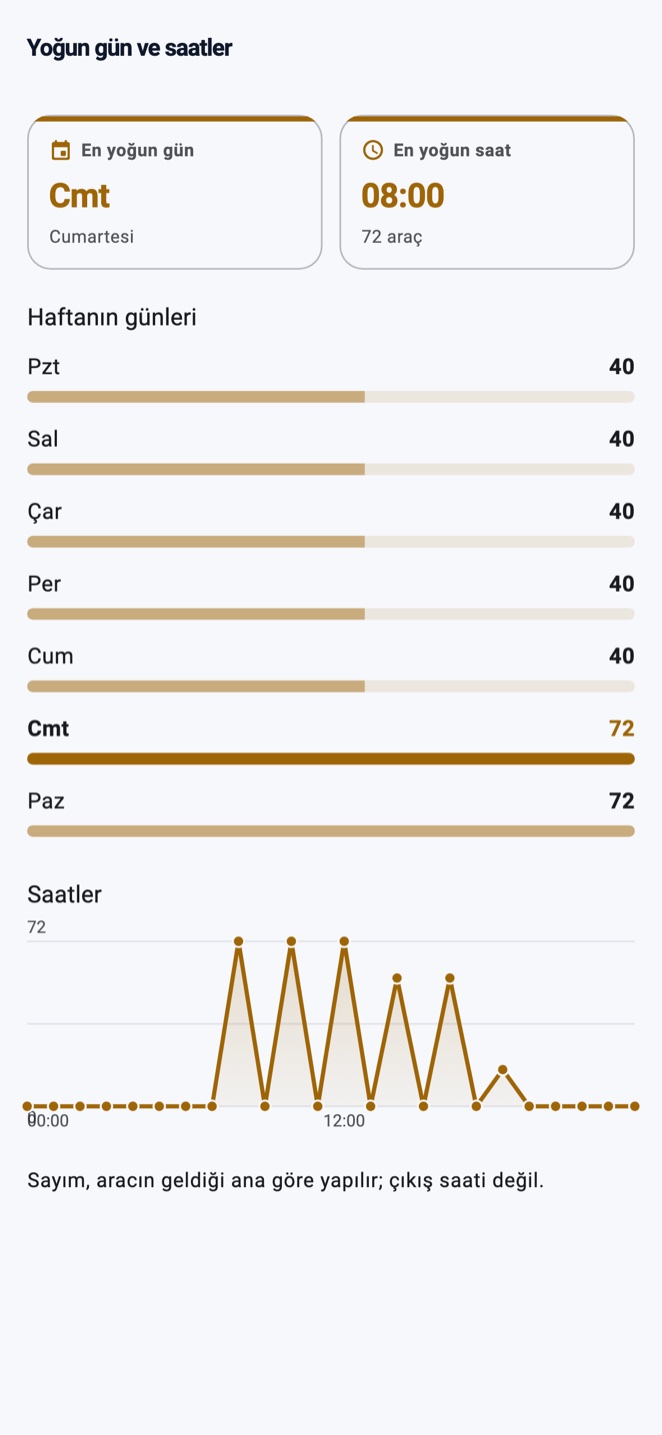 Busyness: weekdays as bars, hours of the day as a line.
This report is the raw material for shift planning: it tells you which hour to call in a second attendant and which day you can give off.
Who comes back most?
The report lists how often the same plate has arrived, how much it has left behind, and when it last came. If the plate is explicitly linked to a customer, their name is shown; otherwise the plate is. The report does not invent identities — it will not infer from history that "this vehicle probably belongs to that person".
Only vehicles that have come at least twice appear. A "loyal customers" screen that everyone enters after a single visit says nothing about loyalty.
How long do they stay?
The length-of-stay report shows the median first, not the mean. The reason is simple: one customer who leaves a car for three days while on holiday drags the mean somewhere unrecognisable and produces a number — "our customers stay about 9 hours" — that describes nobody. The median describes the typical customer; the mean and the longest stay sit underneath it.
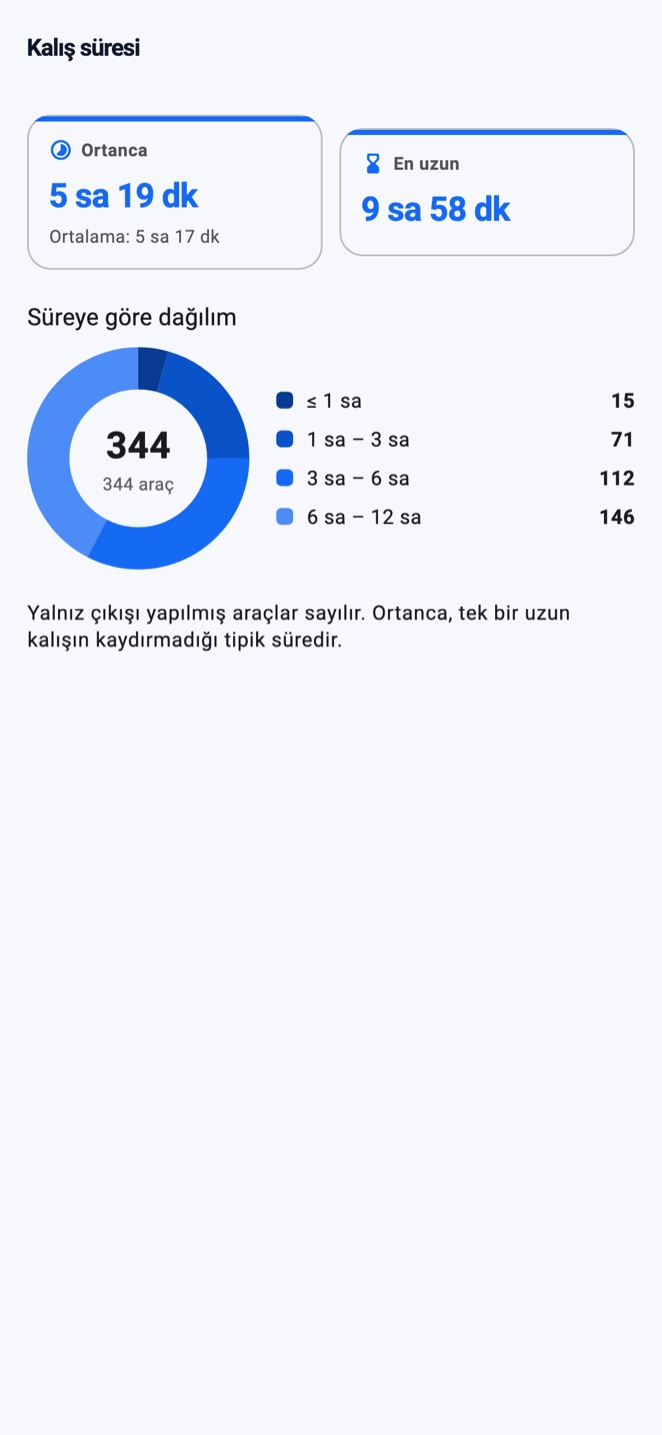 Length of stay: the median first, the distribution underneath.
The distribution is there too: under an hour, 1-3 hours, 3-6 hours, 6-12 hours and over 12 hours. Setting tariff bands against that distribution beats setting them against a hunch.
How full does the car park get?
Occupancy is the highest number of vehicles inside at the same time during the period — not the number of entries in the day. A hundred-space car park may take 300 entries across a day; the answer to the occupancy question is still the busiest moment.
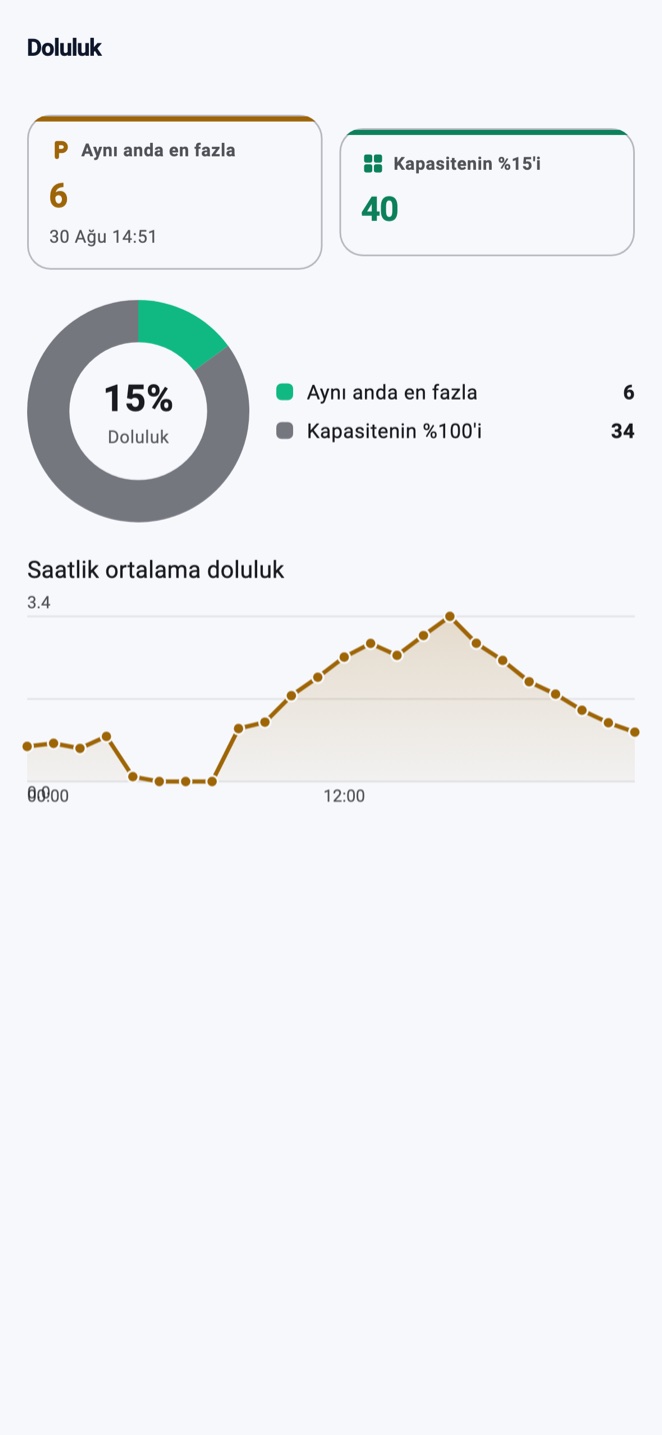 Occupancy: the most vehicles at one time and the ratio to capacity.
If the branch capacity has been entered, a ratio is calculated too. The ratio can exceed 100% and the screen does not clamp it: capacity is a value someone typed, and the car park may genuinely have taken more vehicles. What is wrong may be the capacity record rather than the count — the operator should see that. If no capacity has been entered, no ratio is invented; the screen says the capacity is missing instead.
Average occupancy by hour is also shown: how full the car park was at each hour of the day. The "free spaces" figure on the display board and the occupancy shown on the driver map are fed by the same capacity record.
Where does the data come from, and what happens offline?
Reports are computed from the records on the device; because entry, exit, fee and till all work offline, the reports open without a connection too. When online, the daily summary comes down already totalled from the server and the screen says which source it used — a distinction that matters when an older date range falls outside the local window.
Who can see the reports?
Reports are a management screen: the owner and the branch manager see them, an attendant does not. The attendant still sees the tab, but opening it explains why it is closed — a hidden tab makes people conclude the app simply cannot do it.